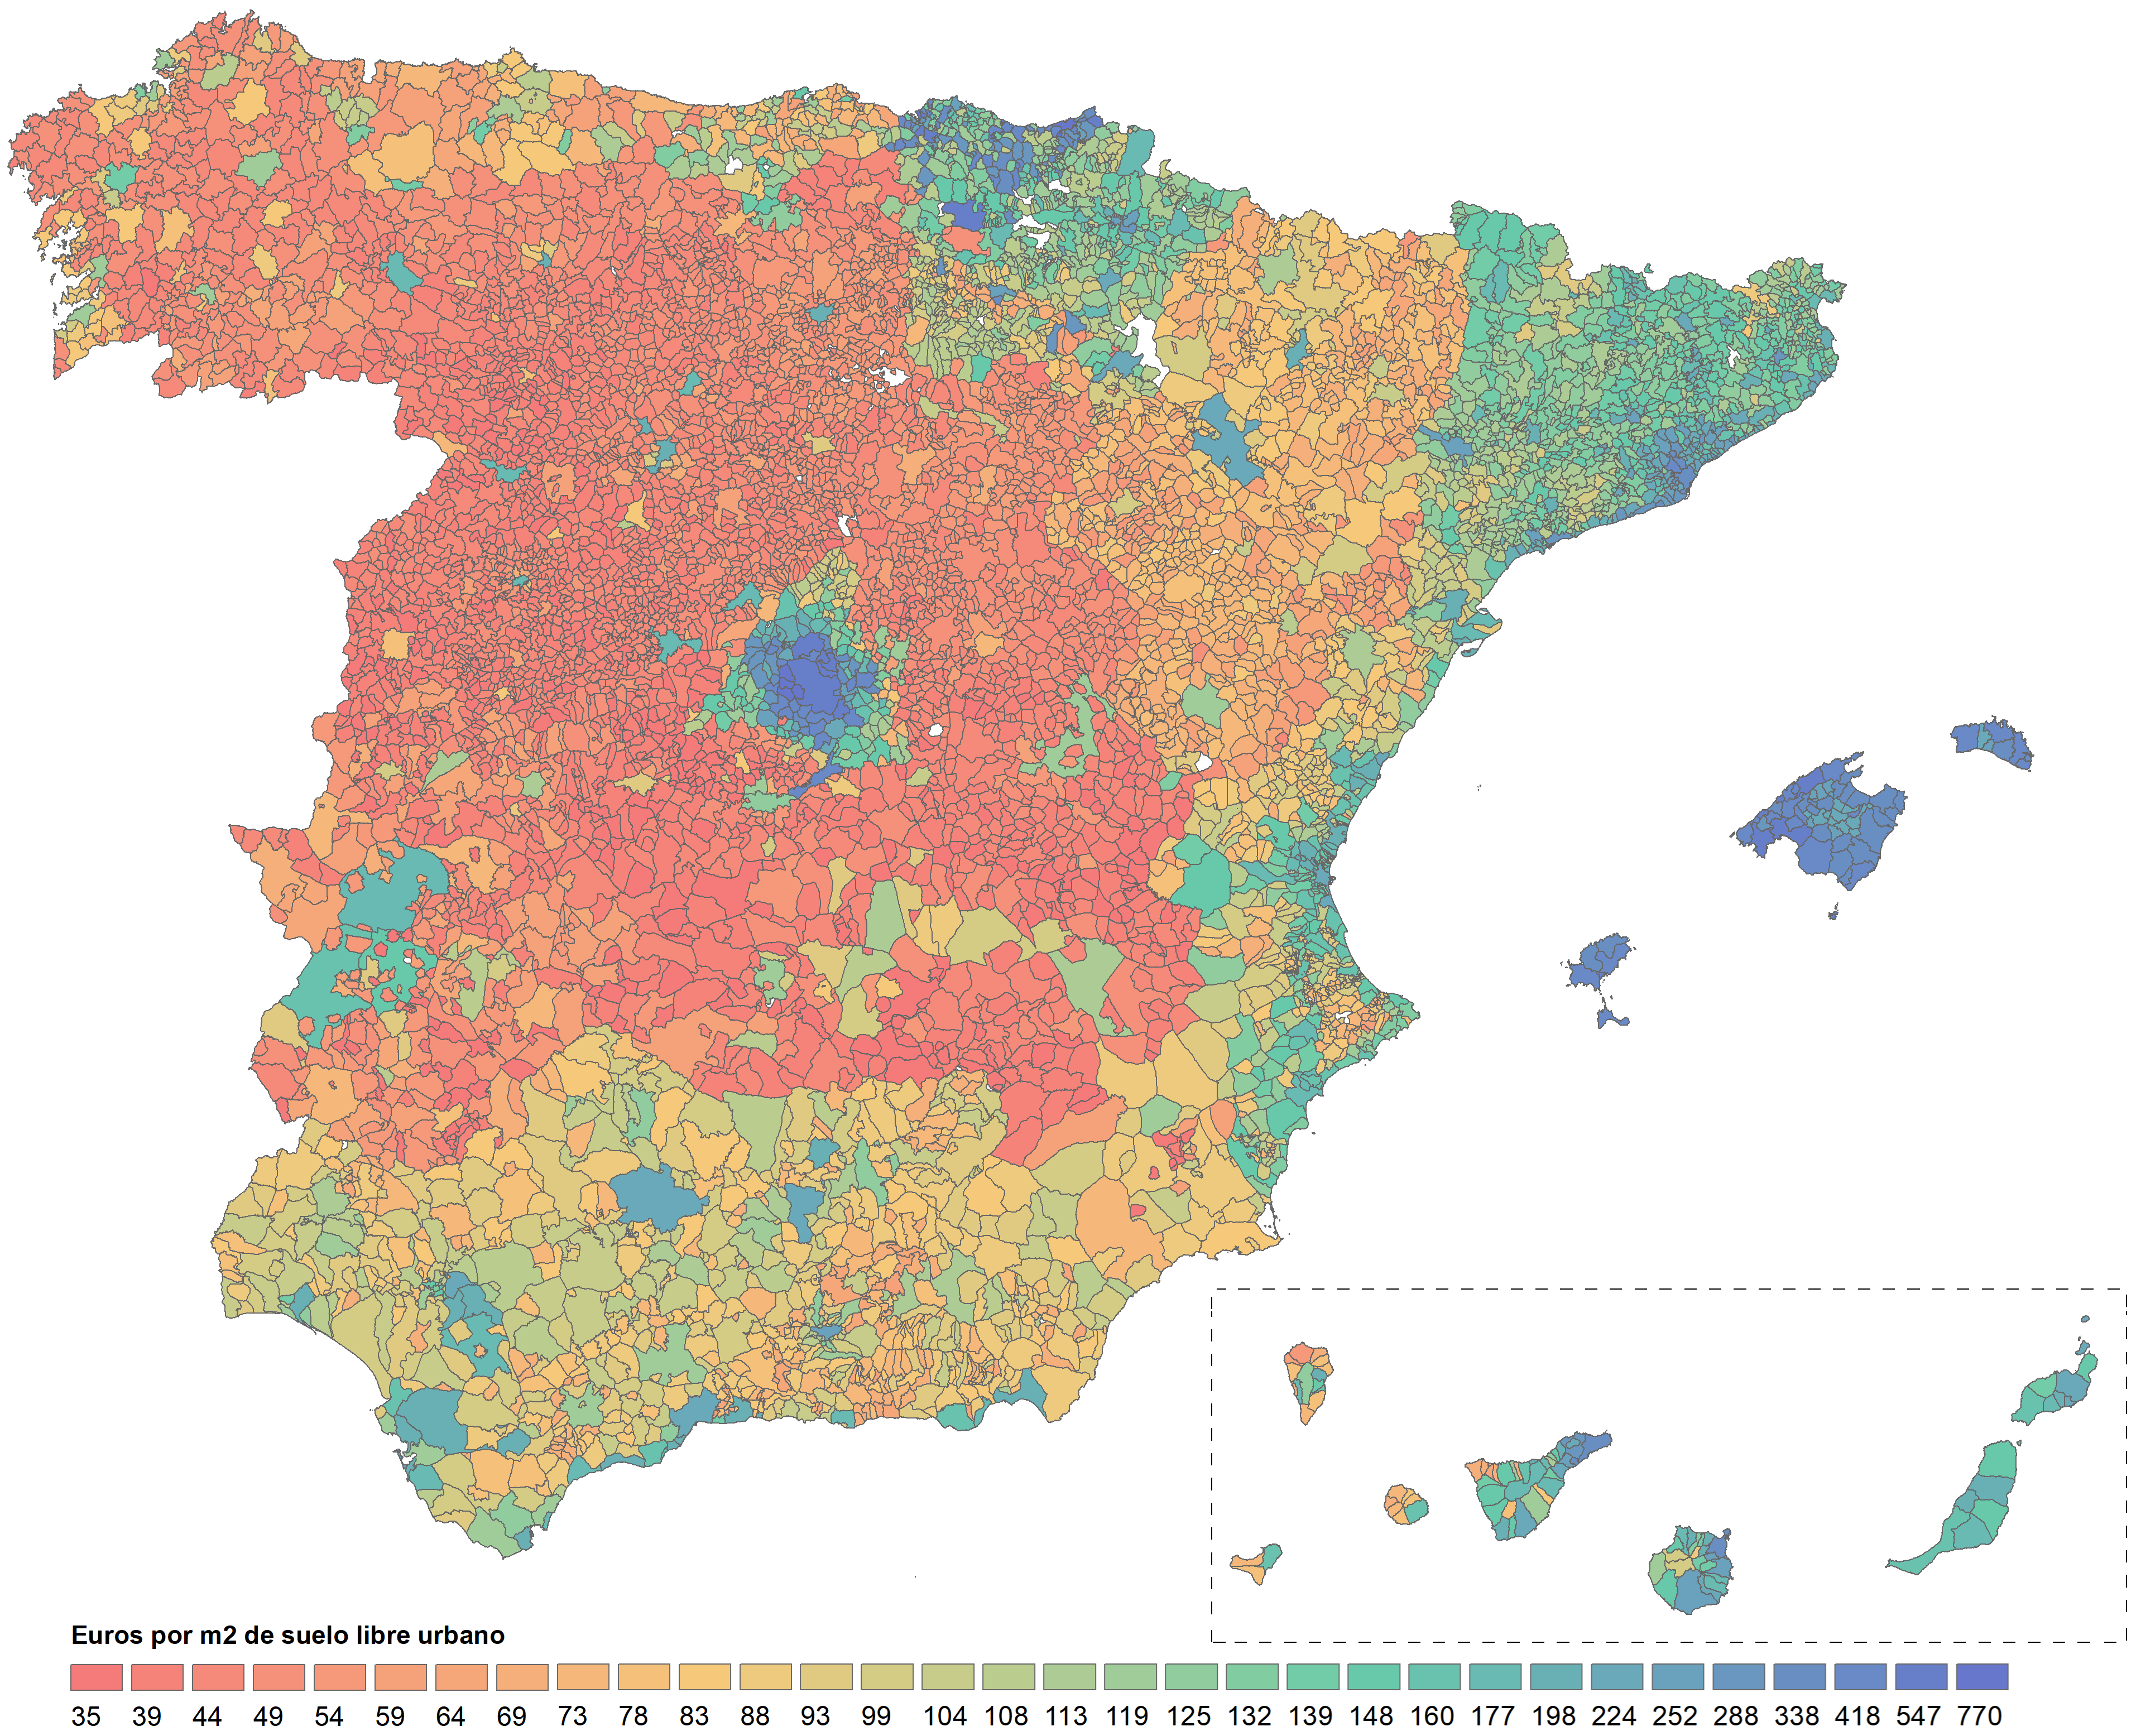
| Color | Label | Range |
|---|---|---|
| 🟥 | No scarcity | One square meter costs up to 69 euros |
| 🟨 | Low scarcity | One square meter costs from 70 to 108 euros |
| 🟩 | Medium scarcity | One square meter costs from 109 to 177 euros |
| 🟦 | High scarcity | One square meter costs from 178 euros up to 770 euros |
For measuring urban land price, we have used a weighted value based on the urban land price of municipalities provided by the MITMA.
The weighted value is the outcome of using the average price of the last 15 years and the average price of the last 5 years, in order to have a value that captures both its current price and its price tendency. Being the formula as follows:
Data sample for better understanding:
| Spanish region | Municipalities by inhabitants | Average price last 15 years | Average price last 5 years | Weighted price value |
|---|---|---|---|---|
| Andalusia | From 1000 to 5000 | 110.3 | 116.4 | 122.1 |
| Andalusia | From 5000 to 10000 | 128.3 | 116.5 | 104.8 |
Commentary for the data sample: Even if both prices are similar (around 116 euros per square meter), the weighted value for municipalities from 1000 to 5000 is higher because the price pressure went upward over the last 15 years. In contrast, municipalities from 5000 to 10000 have a lower value because the pressure went downward.
Because the data provided by the MITMA is grouped by the size of municipalities, it causes some municipalities, such as Málaga (Andalusia), Barcelona (Catalonia) or Valldemossa (Mallorca), to have a lower value than expected. In order to tame this issue, we have used the average net income per person as a corrector.
The corrector relies on the average income per person from each municipality, which is divided by the national average income per person (12,982 euros per year).
The result is then used as a multiplier. Data sample for better understanding:
| Municipality | Weighted price value | Income corrector | Land price value |
|---|---|---|---|
| Barcelona | 233 | 1.35 | 314.6 |
| Sant Antoni de Portmany | 339 | 0.98 | 332.2 |
The Land price value is the one represented on the map.
In a market where supply and demand interact freely, prices tend to reflect the relative scarcity of goods. When a good is scarce and in high demand, its price is likely to increase. Conversely, if a good is abundant or there is low demand for it, the price may decrease. Based on this principle, we could use the price as a measure to approximate urban land scarcity.
It is important to note that price should not be seen as perfect information, since we do not live in a perfect free market, and other factors also affect prices, such as government regulations, government subsidies, price controls, money creation, public or private monopolies, market speculation, branding, advertising, and other market interventions.
For the mathematical notations, the Latex Math API developed by @uechz has been used. A LaTeX editor is accessible at TutorialsPoint.com.