Notes on the real value calculations
The real value is the measure that takes into account the time period's inflation rate, being the purpose to remove the price effect from a data series. It is important to clarify how the real value has been calculated, since 3 different methods have been used for 3 different visualizations:
- Real change rate, used in the Multivariate model.
- Real value, used in Price.
- Real value overrated, used in the Rainbow model.
Data base sample, for following examples:
| Year | Nominal value | Nominal rate (%) | CPI (%) | CPI, 100=1985 | Overrated inflation |
|---|---|---|---|---|---|
| 1985 | 204 | - | 8,83 | 100 | 18,0 |
| 1986 | 244 | 19,61 | 8,80 | 108,8 | 39,5 |
| 1987 | 308 | 26,23 | 5.26 | 114,1 | 55,7 |
| 1988 | 404 | 31,09 | 4,83 | 118,9 | 75,2 |
| 1989 | 503 | 24,46 | 6,79 | 125,7 | 109,3 |
| 1990 | 573 | 13,93 | 6,72 | 132,4 | 147,8 |
1. Real change rate
The real change rate is the difference between the change in nominal price year-on-year minus the inflation rate (CPI) year-on-year. The expression is the following:

Where t means the reference year.
Let's see a basic example for the year(t) 1989:

Therefore, the real price rate increased by 17,67% in 1989.
2. Real value
The real value is a methodology to deflate any nominal data series into real values, using a concrete base year for a selected price index. The method is explained in more depth in this entry from the Federal Reserve - Bank of Dallas. The expression is the following[1]:

Where t means the reference year.
Let's see an example for the year(t) 1987, using the year 1985 as the base year (100) for the price index (CPI):

Therefore, the real house value (at 1985 euros) for the year 1987 equals to 269,93€.
3. Real value overrated
The real value overrated is a formula that discounts the amount of inflation rate on a yearly basis, generating a compound that overrates inflation. It is inaccurate for analyzing the real value (the previous real value should be used instead), but convenient for maximizing trends. The expression is the following:

Where t means the reference year, and the Overrated inflation is expressed as follows:

Where the sum expression starts at the year 1985(t), and ends at the year (n).
Let's see a basic example for the year 1987(n).
As for the Overrated inflation, it is the sum of the years 1985, 1986 and 1987:

Then:

Therefore, the real overrated house value (at 1985 euros) for the year 1987 equals to 252,30€.
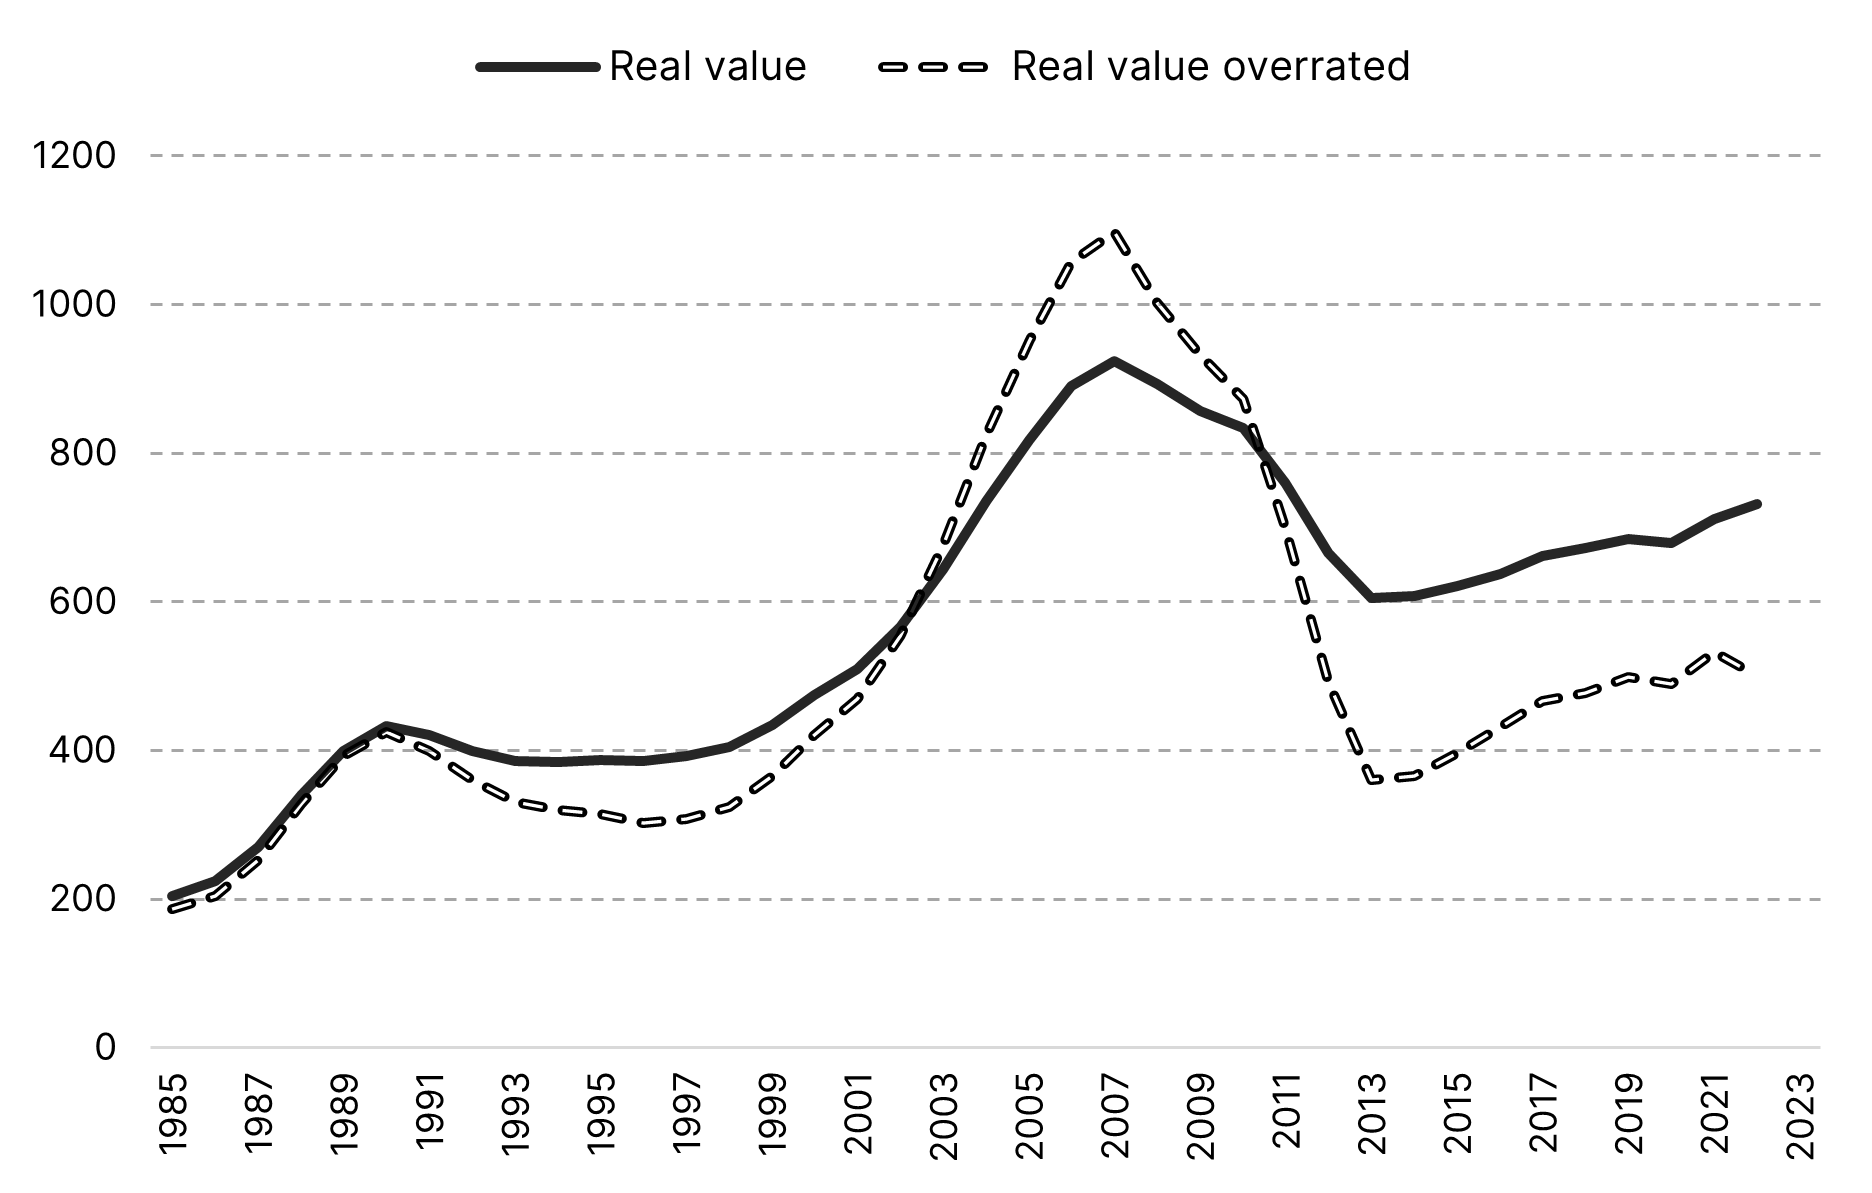
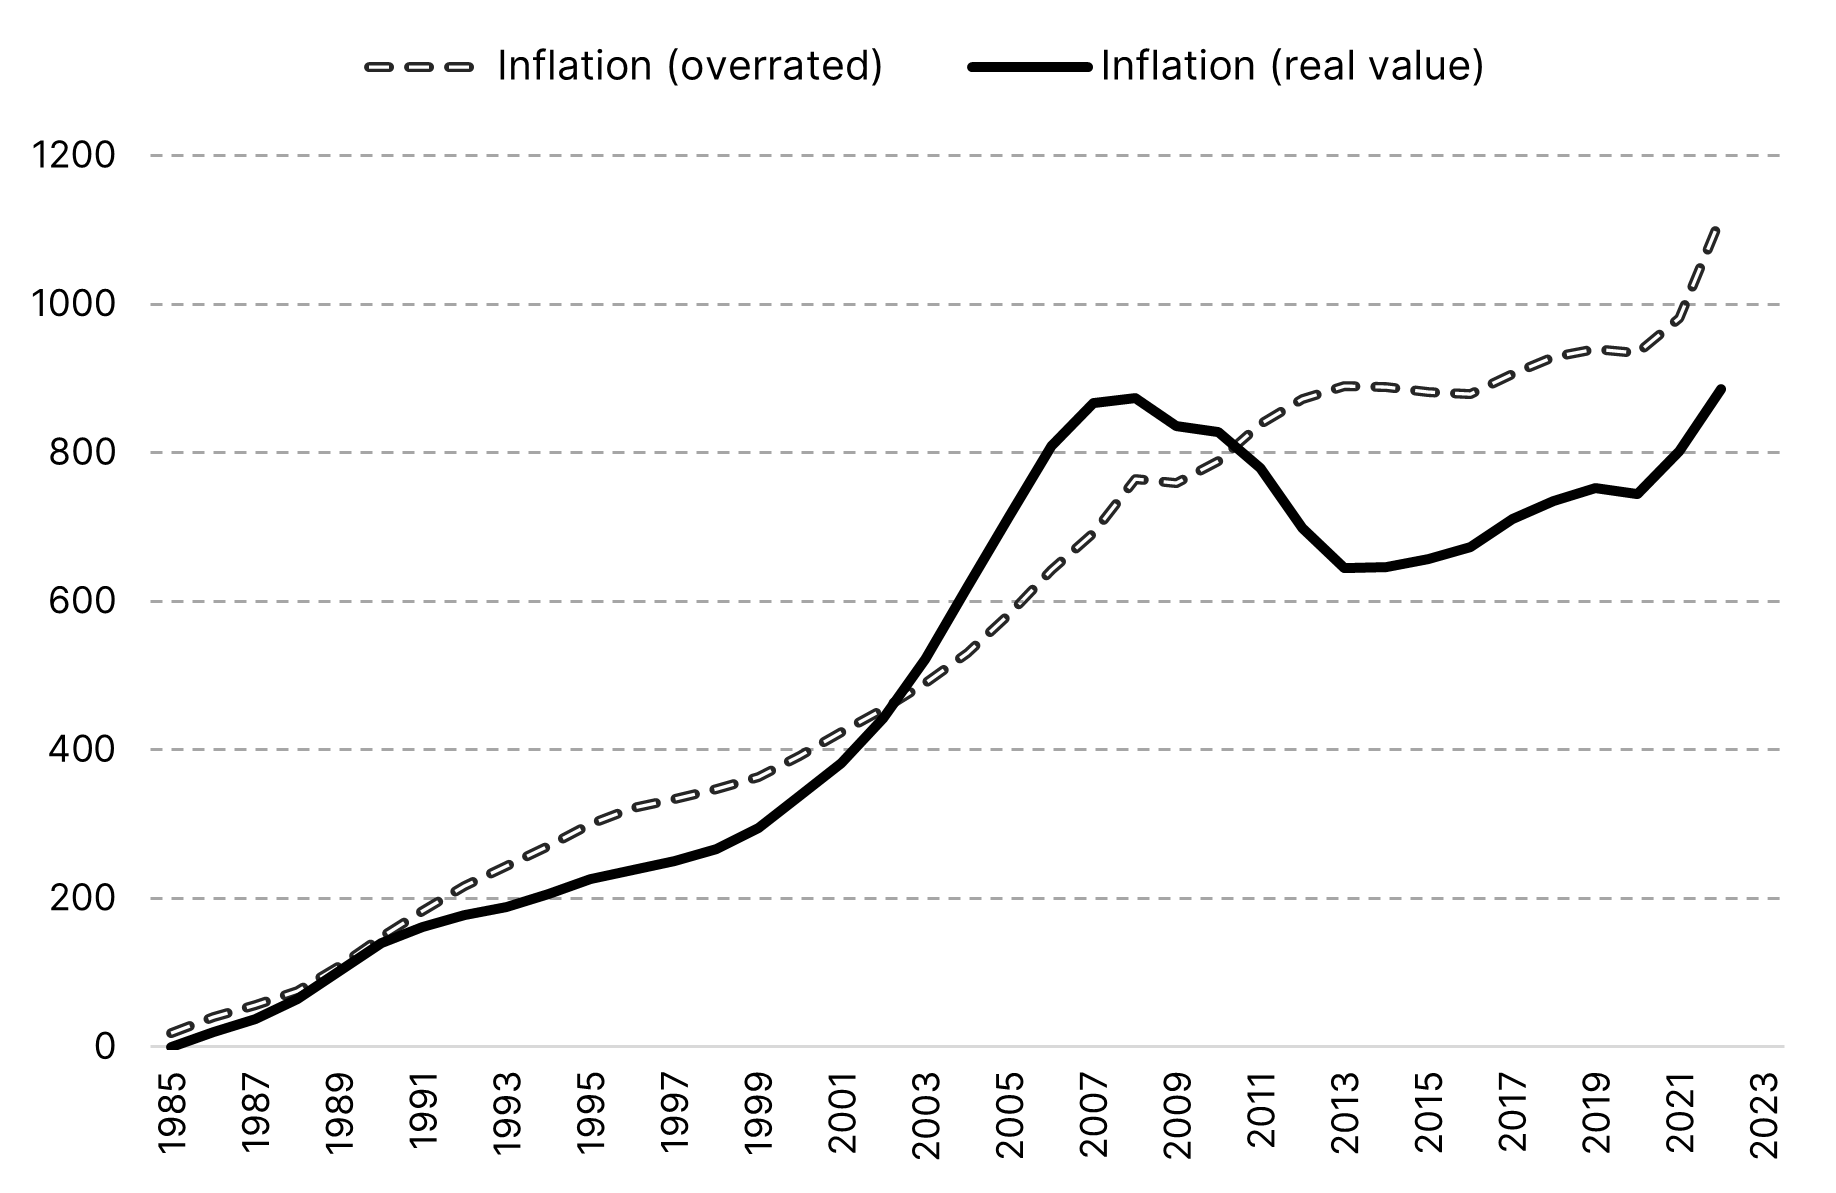
Real value vs. Real value overrated
As means of comparison, in the following charts we can see the behaviour of both the Real value and the Real value overrated.
Notes
For the mathematical notations, the Latex Math Api developed by @uechz has been used. A latex editor is accessible at TutorialsPoint.com.
[1] If the price index is in decimal form, the expression would simply be: Nominal value / Price index.
©HousingSpanish. Creative Commons Attribution-ShareAlike 4.0 International License.